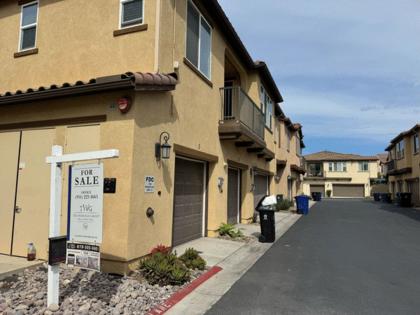
'Bidding wars are in the rear view': San Diego home prices fall in US rankings
Published in Business News
SAN DIEGO — San Diego home prices were down annually for a second month as the region fell in a closely watched real estate index.
The San Diego metropolitan area’s home price decreased 0.66% annually in July, according to the S&P Cotality Case-Shiller Indices report released this week. Prices were down year-over-year by 0.61% the previous month, marking the first time San Diego went negative since June 2023.
San Diego metro, which includes all of San Diego County, was not alone in a downturn. Seven metro areas in the 20-city index were down annually and, nationally, price growth is sluggish.
Experts point to affordability challenges after years of intense price growth, as well as higher mortgage rates, as reasons why the housing market has slowed. Lack of home sales has meant homes are staying on the market significantly longer, with more for buyers to choose from.
“With more inventory available, intense bidding wars are in the rear view mirror,” said Sheharyar Bokhari, a Redfin senior economist, “so buyers have room to negotiate.”
He said the picture wasn’t horrible for sellers because national home prices were holding steady, up 1.8% in a year. Yet there was a lot of variation among metro areas. New York topped the index with prices up 6.43% annually, followed by Chicago at 4.46% and Cleveland at 4.46%.
San Diego ranked No. 15 on the 20-city index. The biggest drop was Tampa, down 2.81% in a year, followed by San Francisco, down 1.92%, and Miami, down 1.3%.
The Case-Shiller index tracks repeat sales of identical single-family houses — and are seasonally adjusted — as they turn over through the years. It is often seen as a bellwether of the economy as a whole.
San Diego County’s median home price for single-family homes in July was $1 million, said Attom Data Solutions, remaining one of the most expensive markets in the nation. The median is the point at which half the homes sold for more and half for less.
Nicholas Godec, head of fixed income and commodities at S&P Dow Jones Indices, said the variation in cities topping price growth has flipped from the post-pandemic market, when Sun Belt cities were regularly breaking price growth records.
“The markets now on top (like Chicago or Cleveland) tend to be more affordable and supported by steady local economies,” he said, “whereas the ones stumbling (like San Francisco or Phoenix) are grappling with stretched affordability and the comedown from speculative fervor.”
Mortgage rates have now gone down slightly (6.34% average for a 30-year fixed on Thursday) but were higher for the time period covered in this report. At the end of July, the average for a 30-year, fixed-rate mortgage was 6.72%, according to Freddie Mac.
Lisa Sturtevant, chief economist at Bright MLS, said a change in mortgage rates is likely not enough to jump-start sales activity, which is at record lows. She said an increase in sales would likely come after home inventory greatly increases and sellers adjust price expectations.
Annual price growth by metropolitan area
S&P/Case-Shiller Home Price Index, July 2025
New York: 6.43%Chicago: 6.23%Cleveland: 4.46%Boston: 4.06%Detroit: 4.05%Minneapolis: 2.62%Charlotte: 2.13%Washington, D.C.: 1.31%Portland: 1.10%Las Vegas: 0.97%Atlanta: 0.72%Los Angeles-Anaheim: 0.22%Seattle: 0.16%Denver: -0.63%San Diego: -0.66%Phoenix: -0.90%Dallas: -1.25%Miami: -1.30%San Francisco: -1.92%Tampa: -2.81%
National: 1.68%
_____
©2025 The San Diego Union-Tribune. Visit sandiegouniontribune.com. Distributed by Tribune Content Agency, LLC.


Comments